Methods
Test design
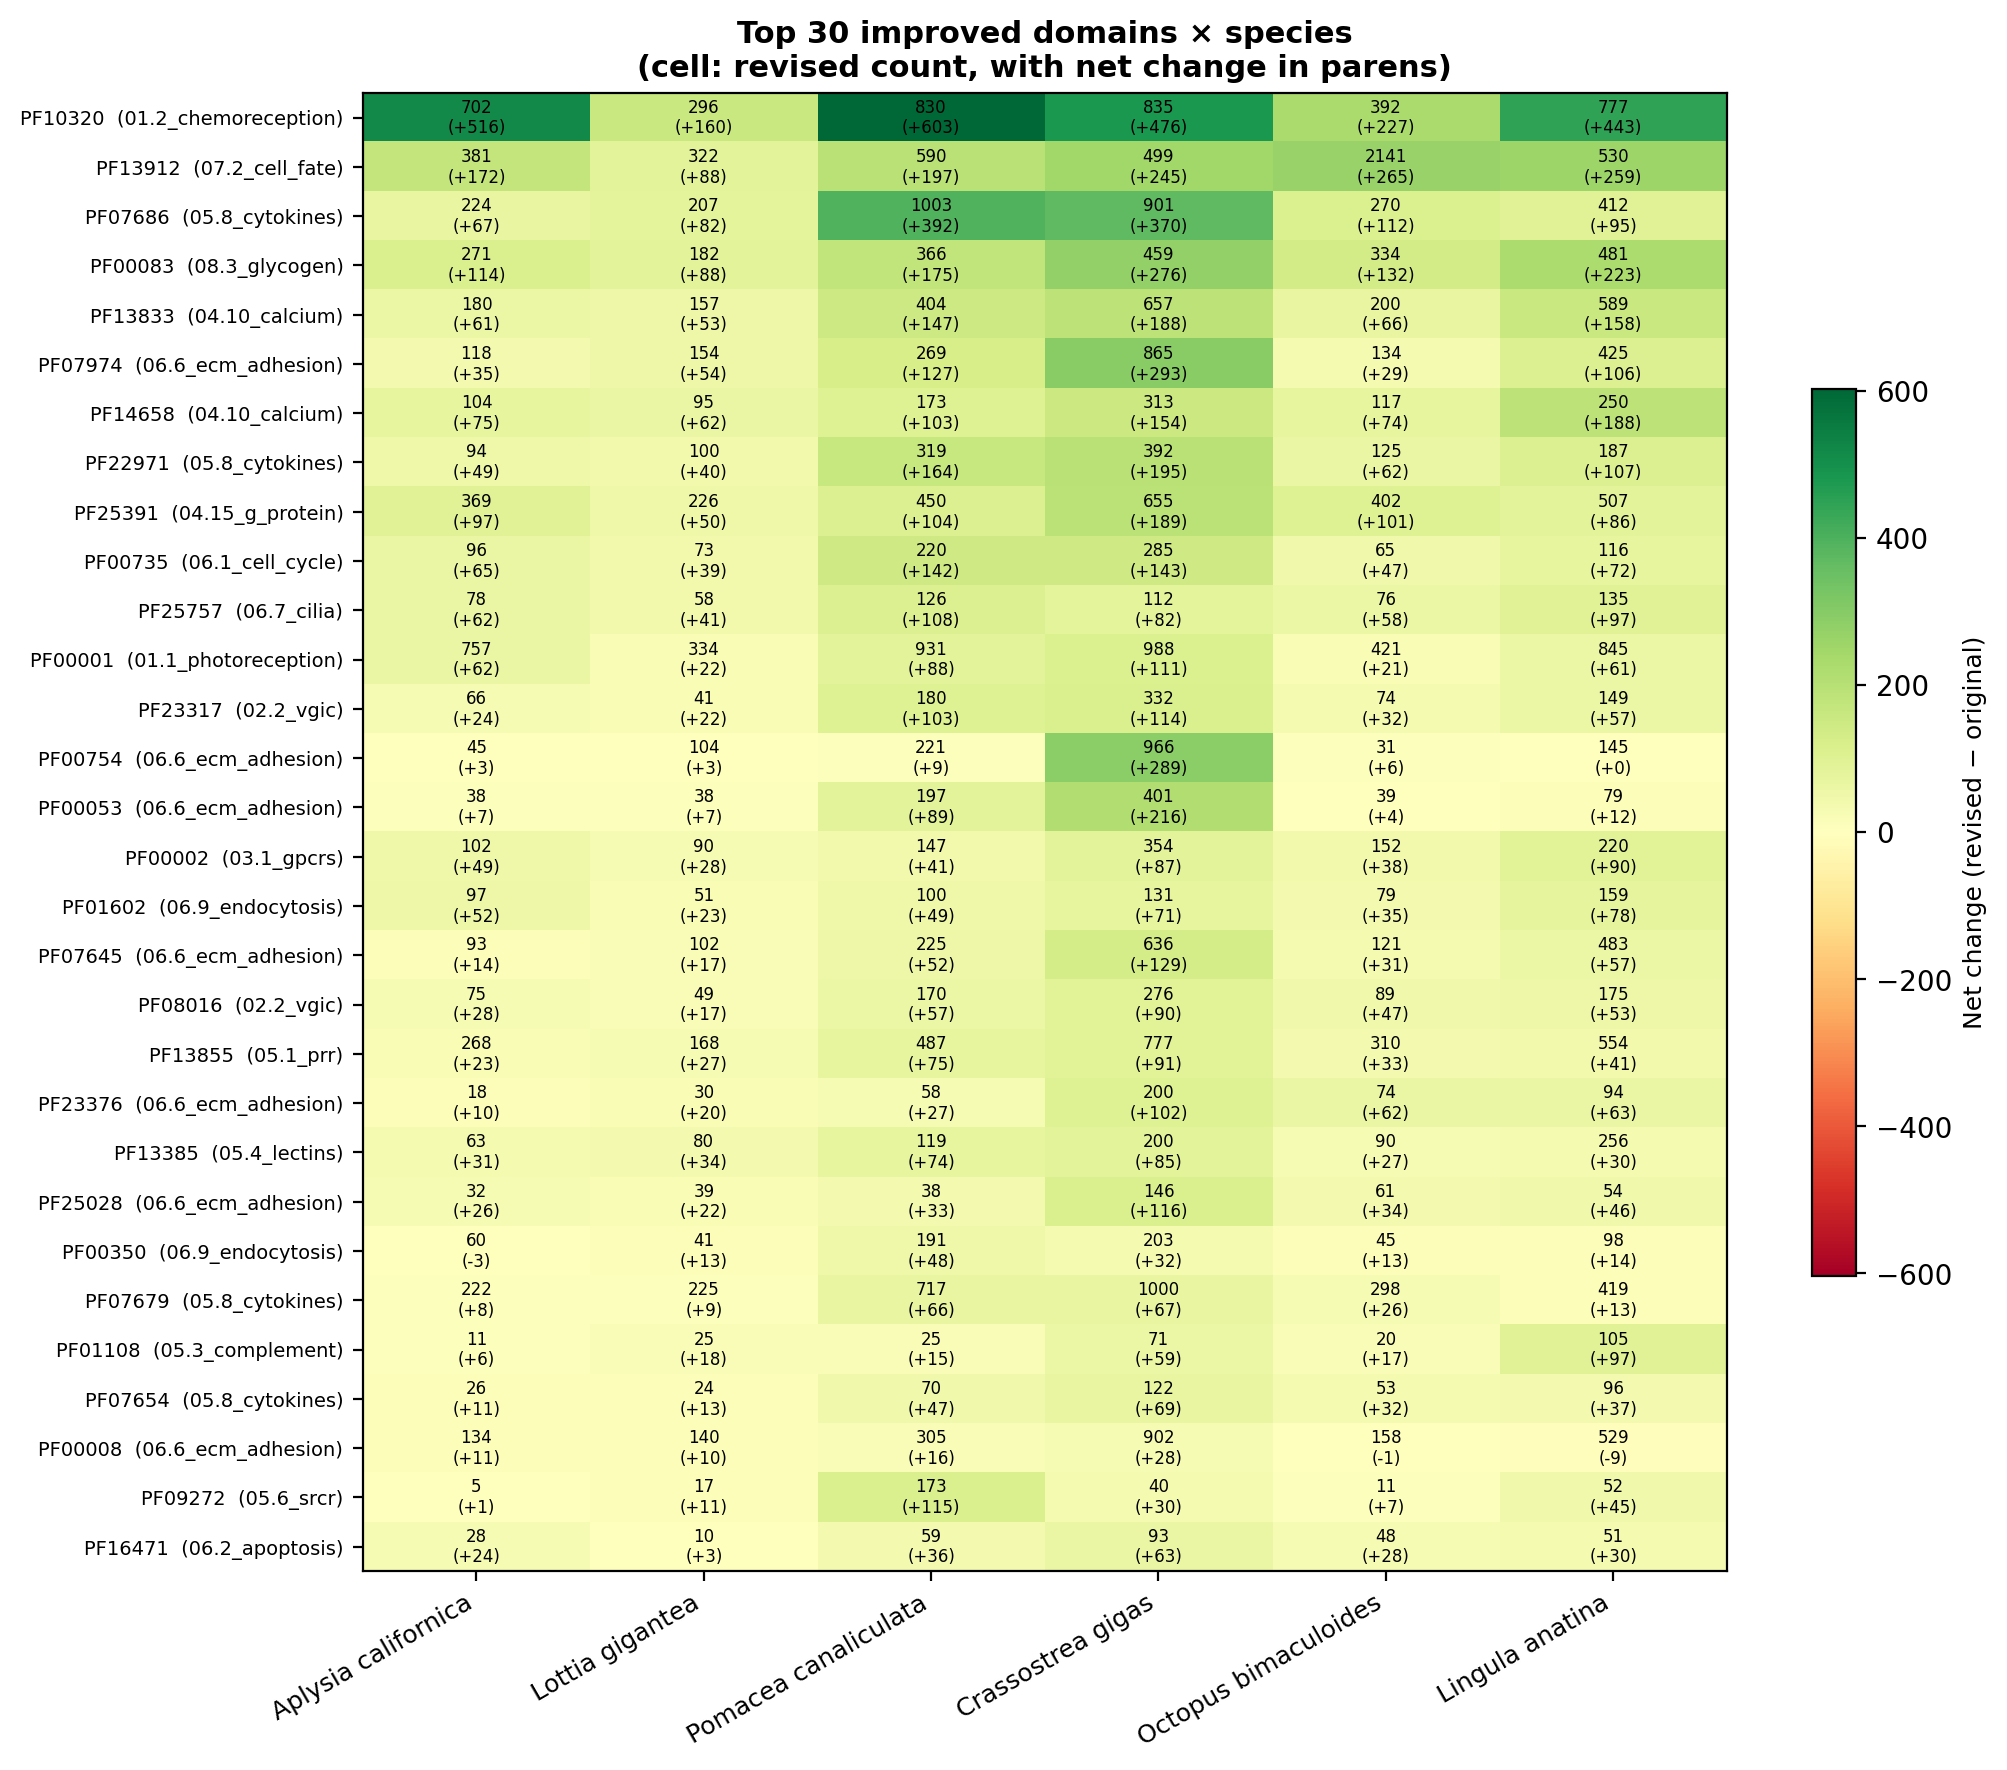
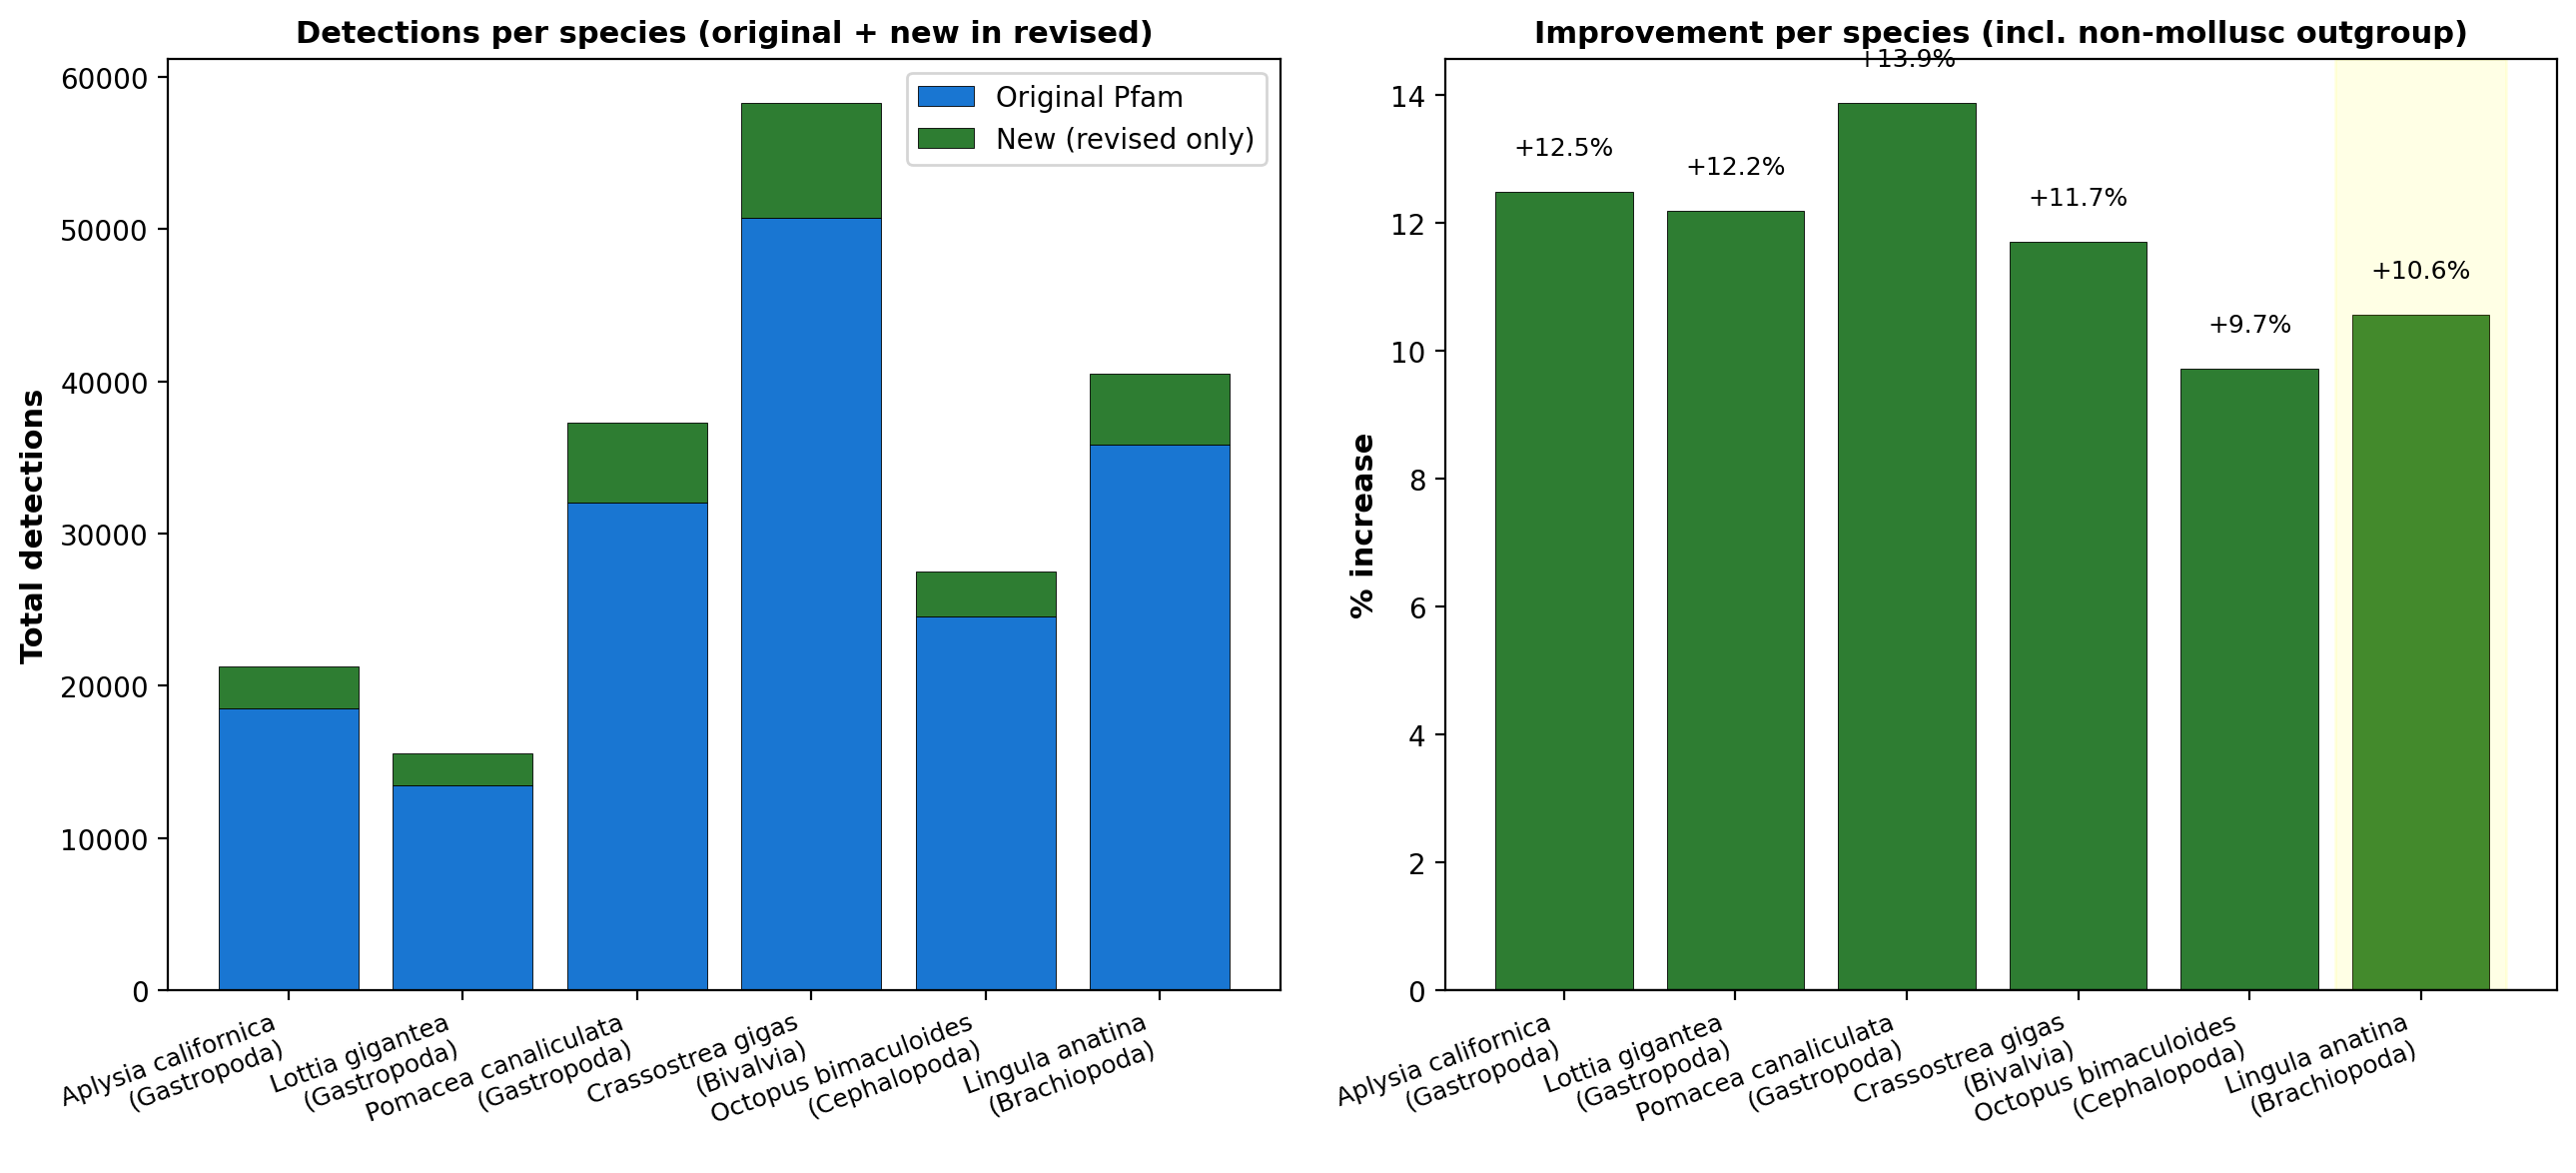
We assembled six RefSeq reference proteomes that were not used during
HMM revision (formally, a held-out evaluation): five molluscs spanning
three classes — Aplysia californica,
Lottia gigantea, and
Pomacea canaliculata (Gastropoda);
Crassostrea gigas (Bivalvia);
Octopus bimaculoides (Cephalopoda)
— plus one non-mollusc lophotrochozoan outgroup,
Lingula anatina (Brachiopoda),
included to gauge cross-phylum transfer.
Held-out proteomes ranged from 23,822 (L. gigantea)
to 63,341 (C. gigas) protein
sequences, totaling roughly 225,000 sequences across the panel.
HMM databases compared
Two databases were compared head-to-head on identical inputs. The
baseline is original Pfam-A 36.0, restricted to the same 1,057
accessions selected for mollusc curation. The contender is the
mollusc-optimized bundle: 909 of those same 1,057 accessions revised
by TIAMMAt against 212 mollusc proteomes from MolluscaGenes v1
(iterative re-alignment of each Pfam family to its high-confidence
mollusc hits, rebuilding the profile), plus 148 accessions whose
revisions did not meet the per-HMM specificity criteria and use the
original Pfam-A 36.0 profile (see HMM specificity QC below).
Both databases were concatenated under POSIX LC_ALL=C
order and indexed with hmmpress. Byte-identity of the
canonical concat is pinned by SHA-256.
HMM specificity quality control
Each revised HMM is screened for specificity against the
six-proteome held-out panel. For each HMM we compute the total
detection count, median E-value of detections, and fraction of
detections at strong significance
(E ≤ 10−30). The criteria flag
revisions whose detections concentrate near the threshold without
strong-match support: count > 100 with strong-match rate < 5%
and median log10(E) > −15
(NOISE); count > 5× original with
strong-match rate < 10% (OVERGEN); or original
strong-match rate > 30% but revised dropped by more than half
(SPEC_LOSS).
HMMs that do not meet the specificity criteria —
predominantly coiled-coil-rich structural families (SCP-1,
Filament, Tropomyosin, Laminin) and orphan-class GPCR families
that admit high-density alignment matches without strong
sequence-level homology — retain the original Pfam-A 36.0
profile in the bundle. 909 of 1,057 HMMs (86%) carry the TIAMMAt
revision; 148 (14%) use the original Pfam-A 36.0 profile. The full
per-HMM specificity report is at
evaluation/hmm_specificity_qc.tsv in the bundle.
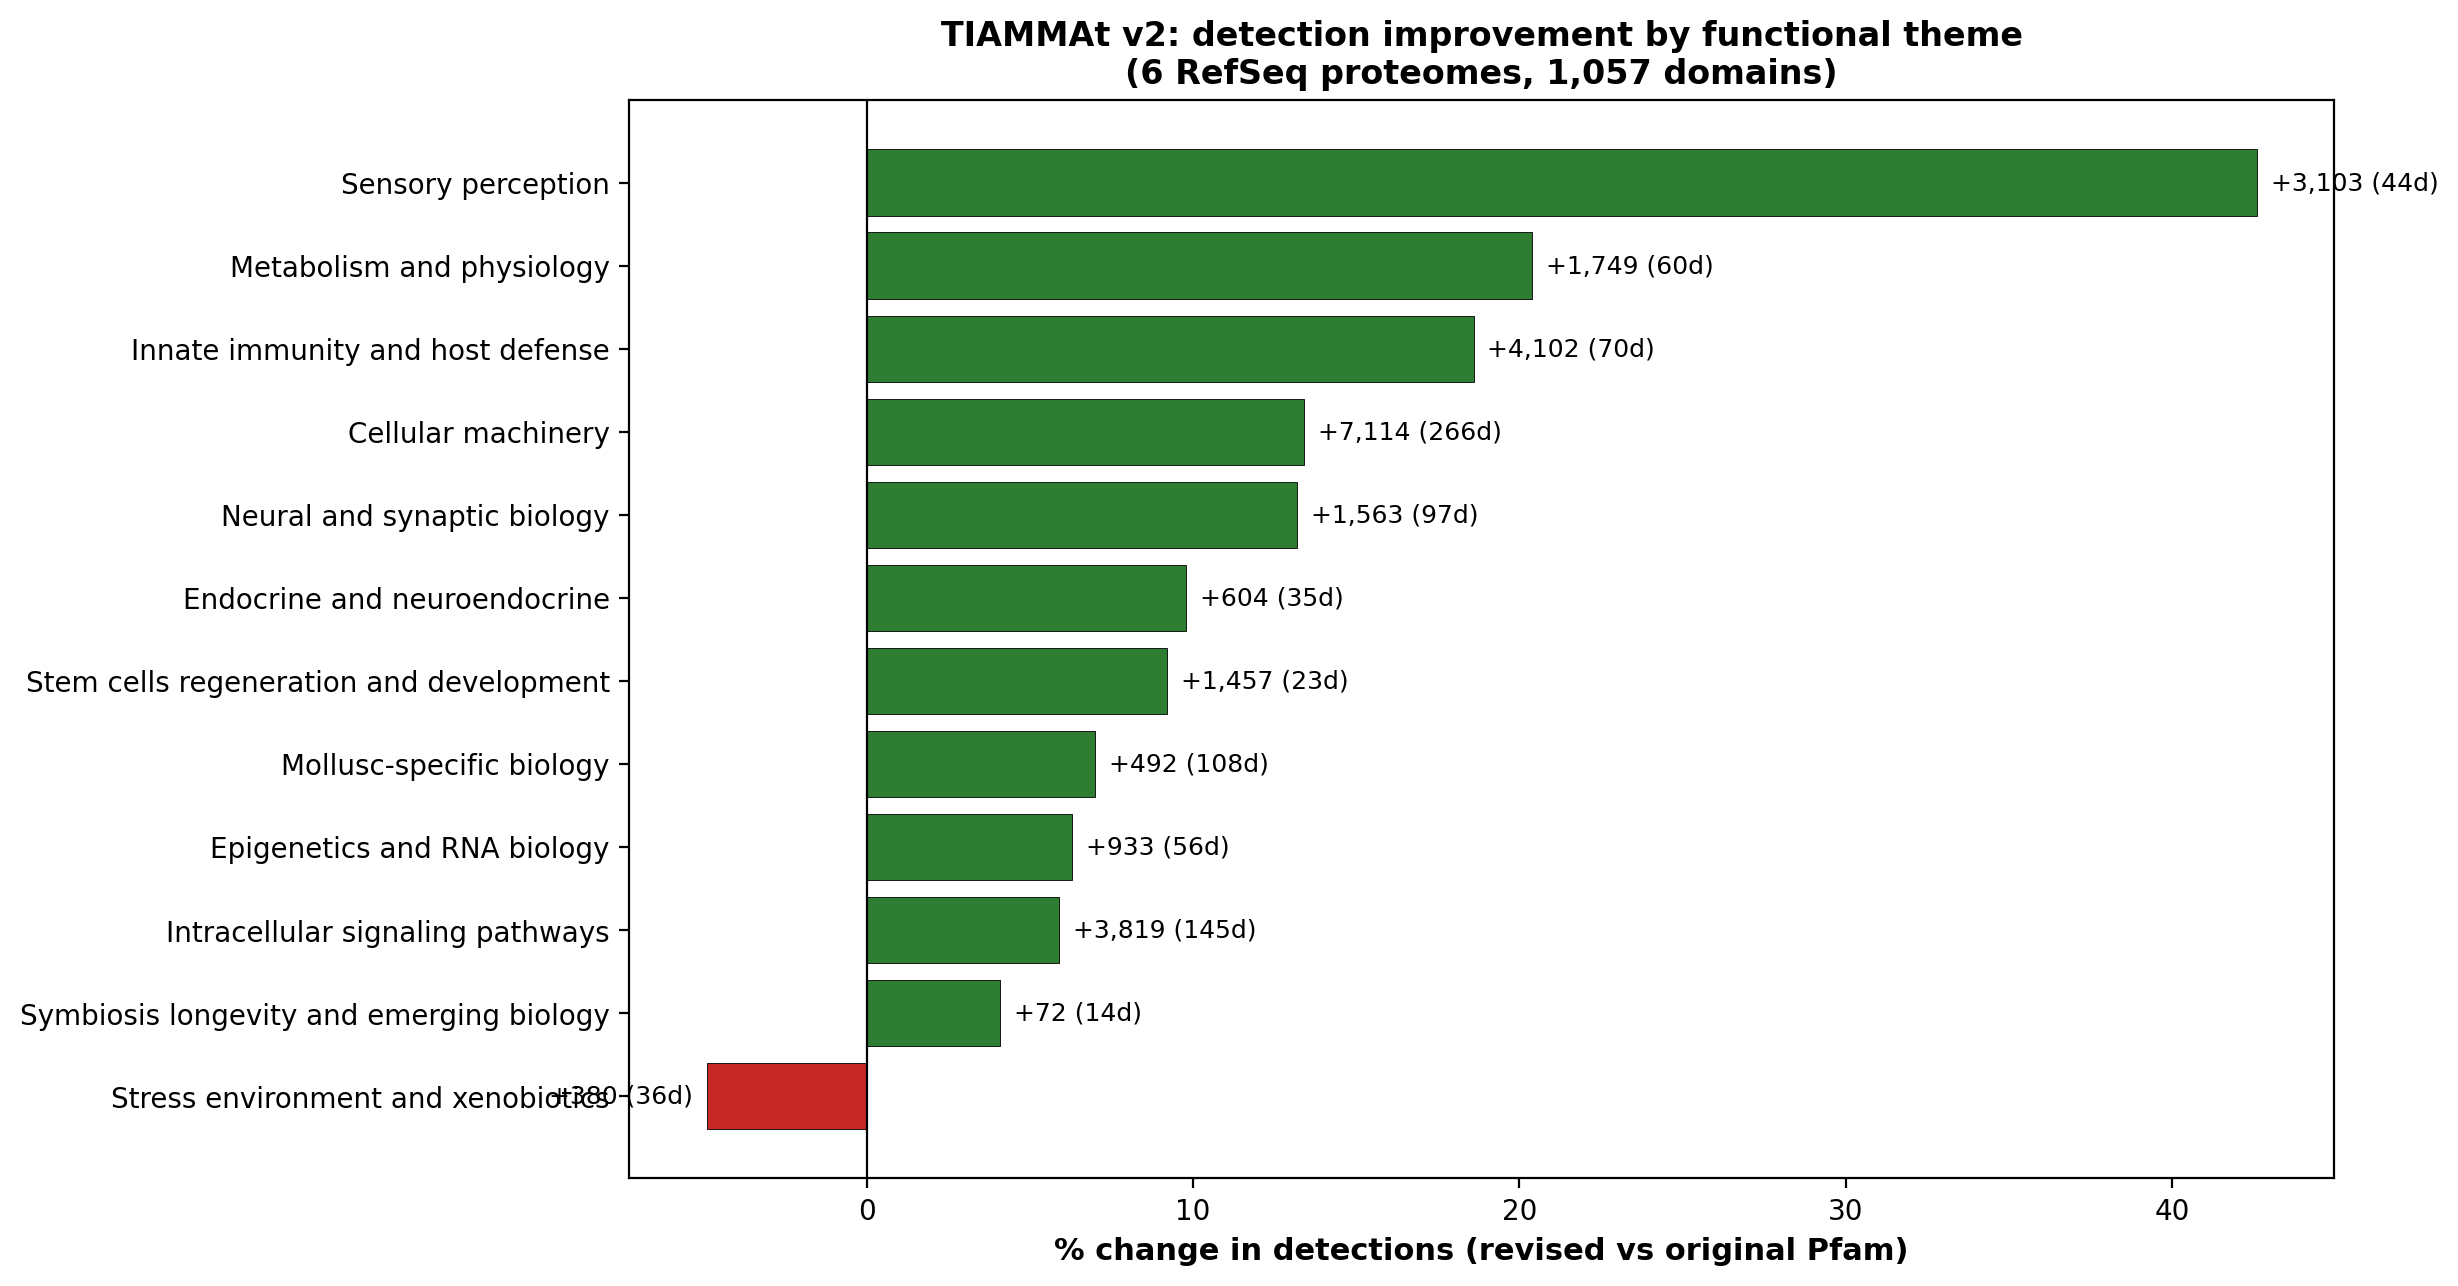
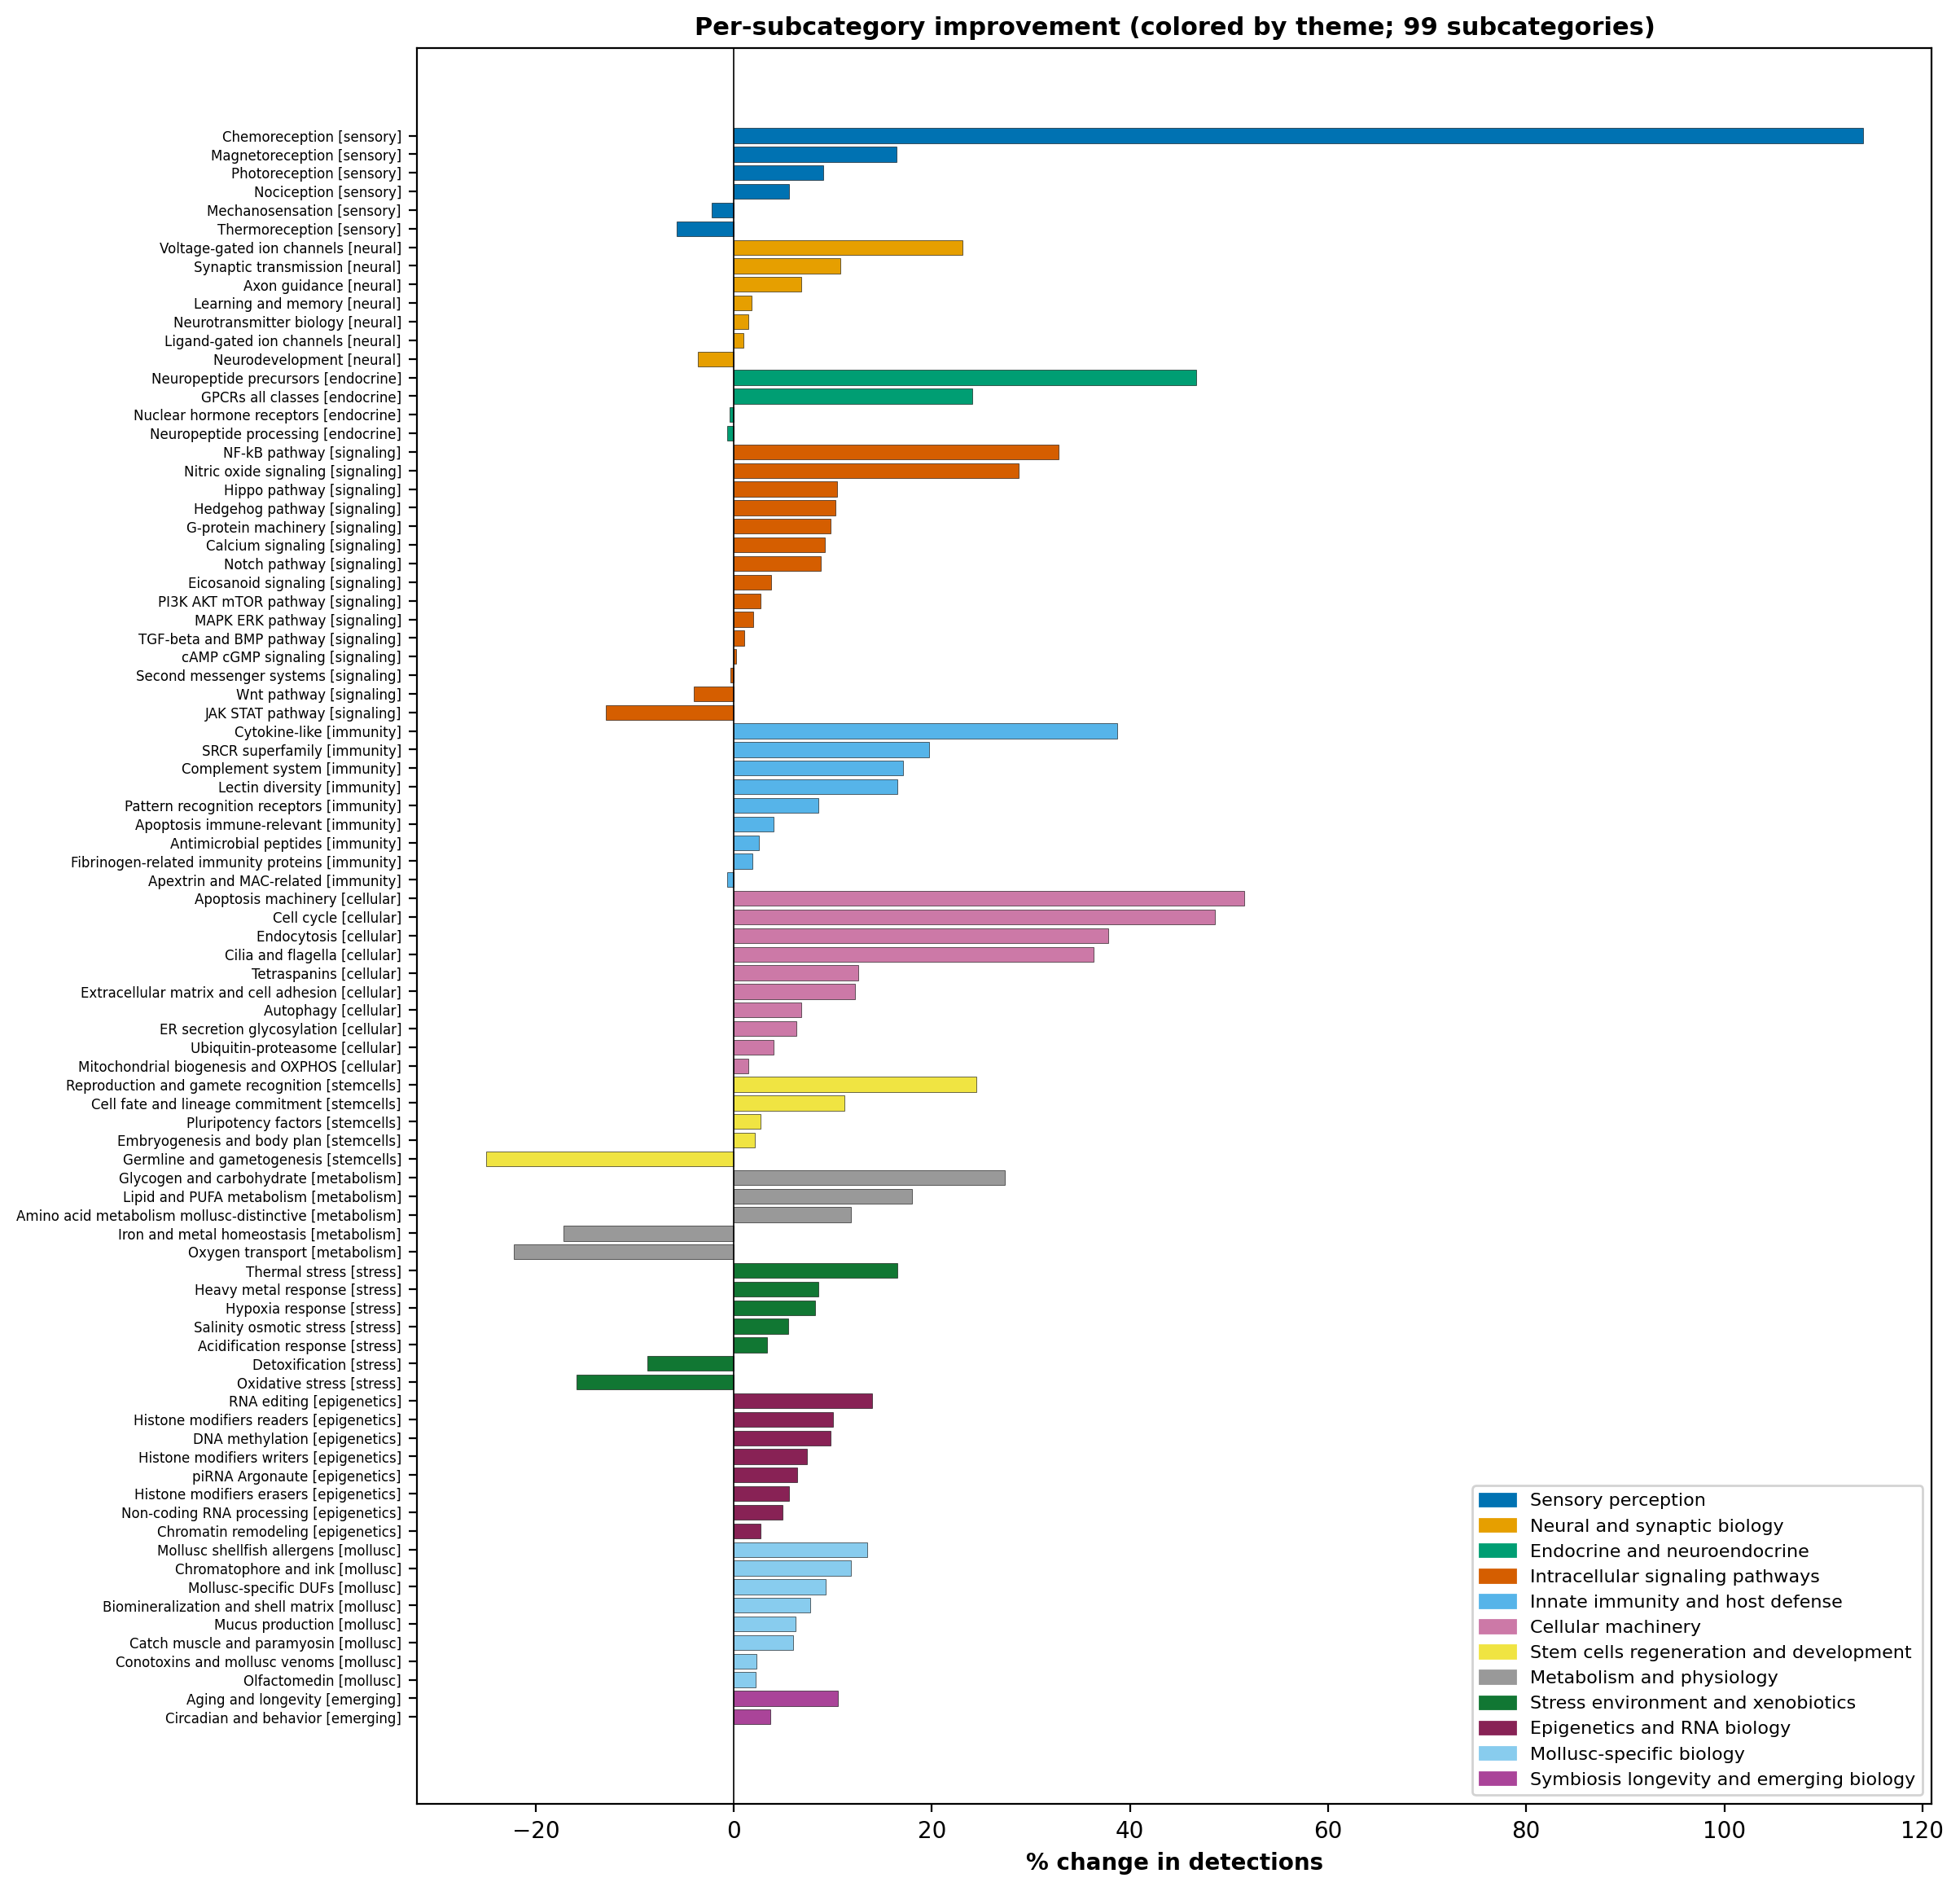
Curation taxonomy
Each Pfam domain is annotated with a primary subcategory and theme
within the 12-theme / 104-subcategory curation schema. Assignments
are reviewed against each domain’s Pfam-A 36.0 NAME and DESC
fields, with explicit hand-validated overrides for canonical cases
(rhodopsin-family → photoreception, voltage-gated channels
→ VGIC, etc.). The complete taxonomy is at
taxonomy/domain_list.tsv in the bundle.
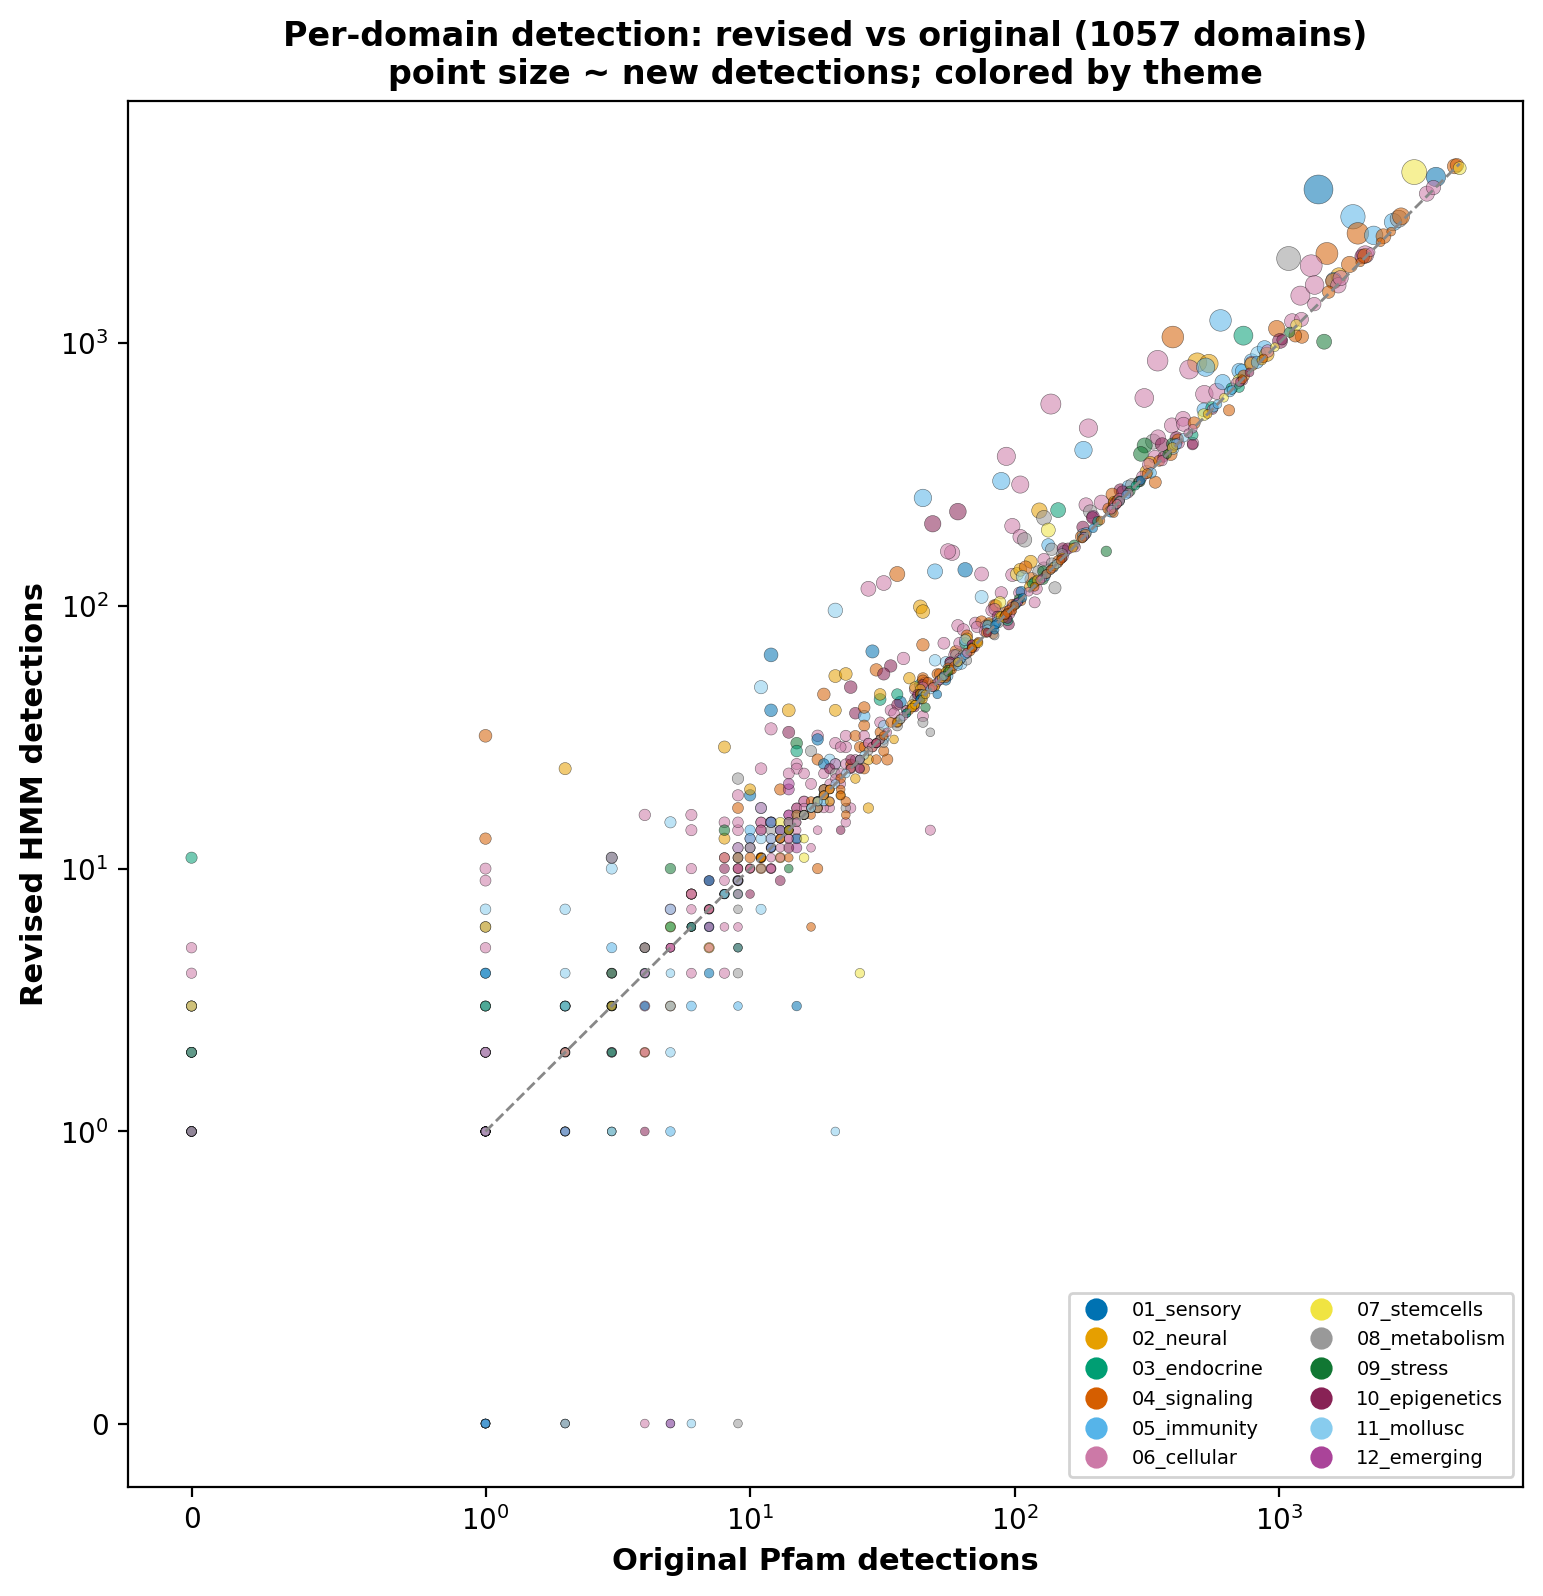
Detection criteria
For each evaluation proteome we ran hmmscan (HMMER 3.4)
against both databases with --domE 1e-5 --incdomE 1e-5,
capturing per-sequence and per-domain output. A sequence was counted
as detected by domain D if any reported domain on that
sequence had target D at the cutoff (best E-value taken on
ties).
For specificity analysis we use a stricter threshold to define what
we call a “real loss”: an original-only detection counts
as a real loss only if its full-sequence E-value in the original DB
is at most 10−8. Anything weaker is treated as
marginal evidence and pooled with rejections.
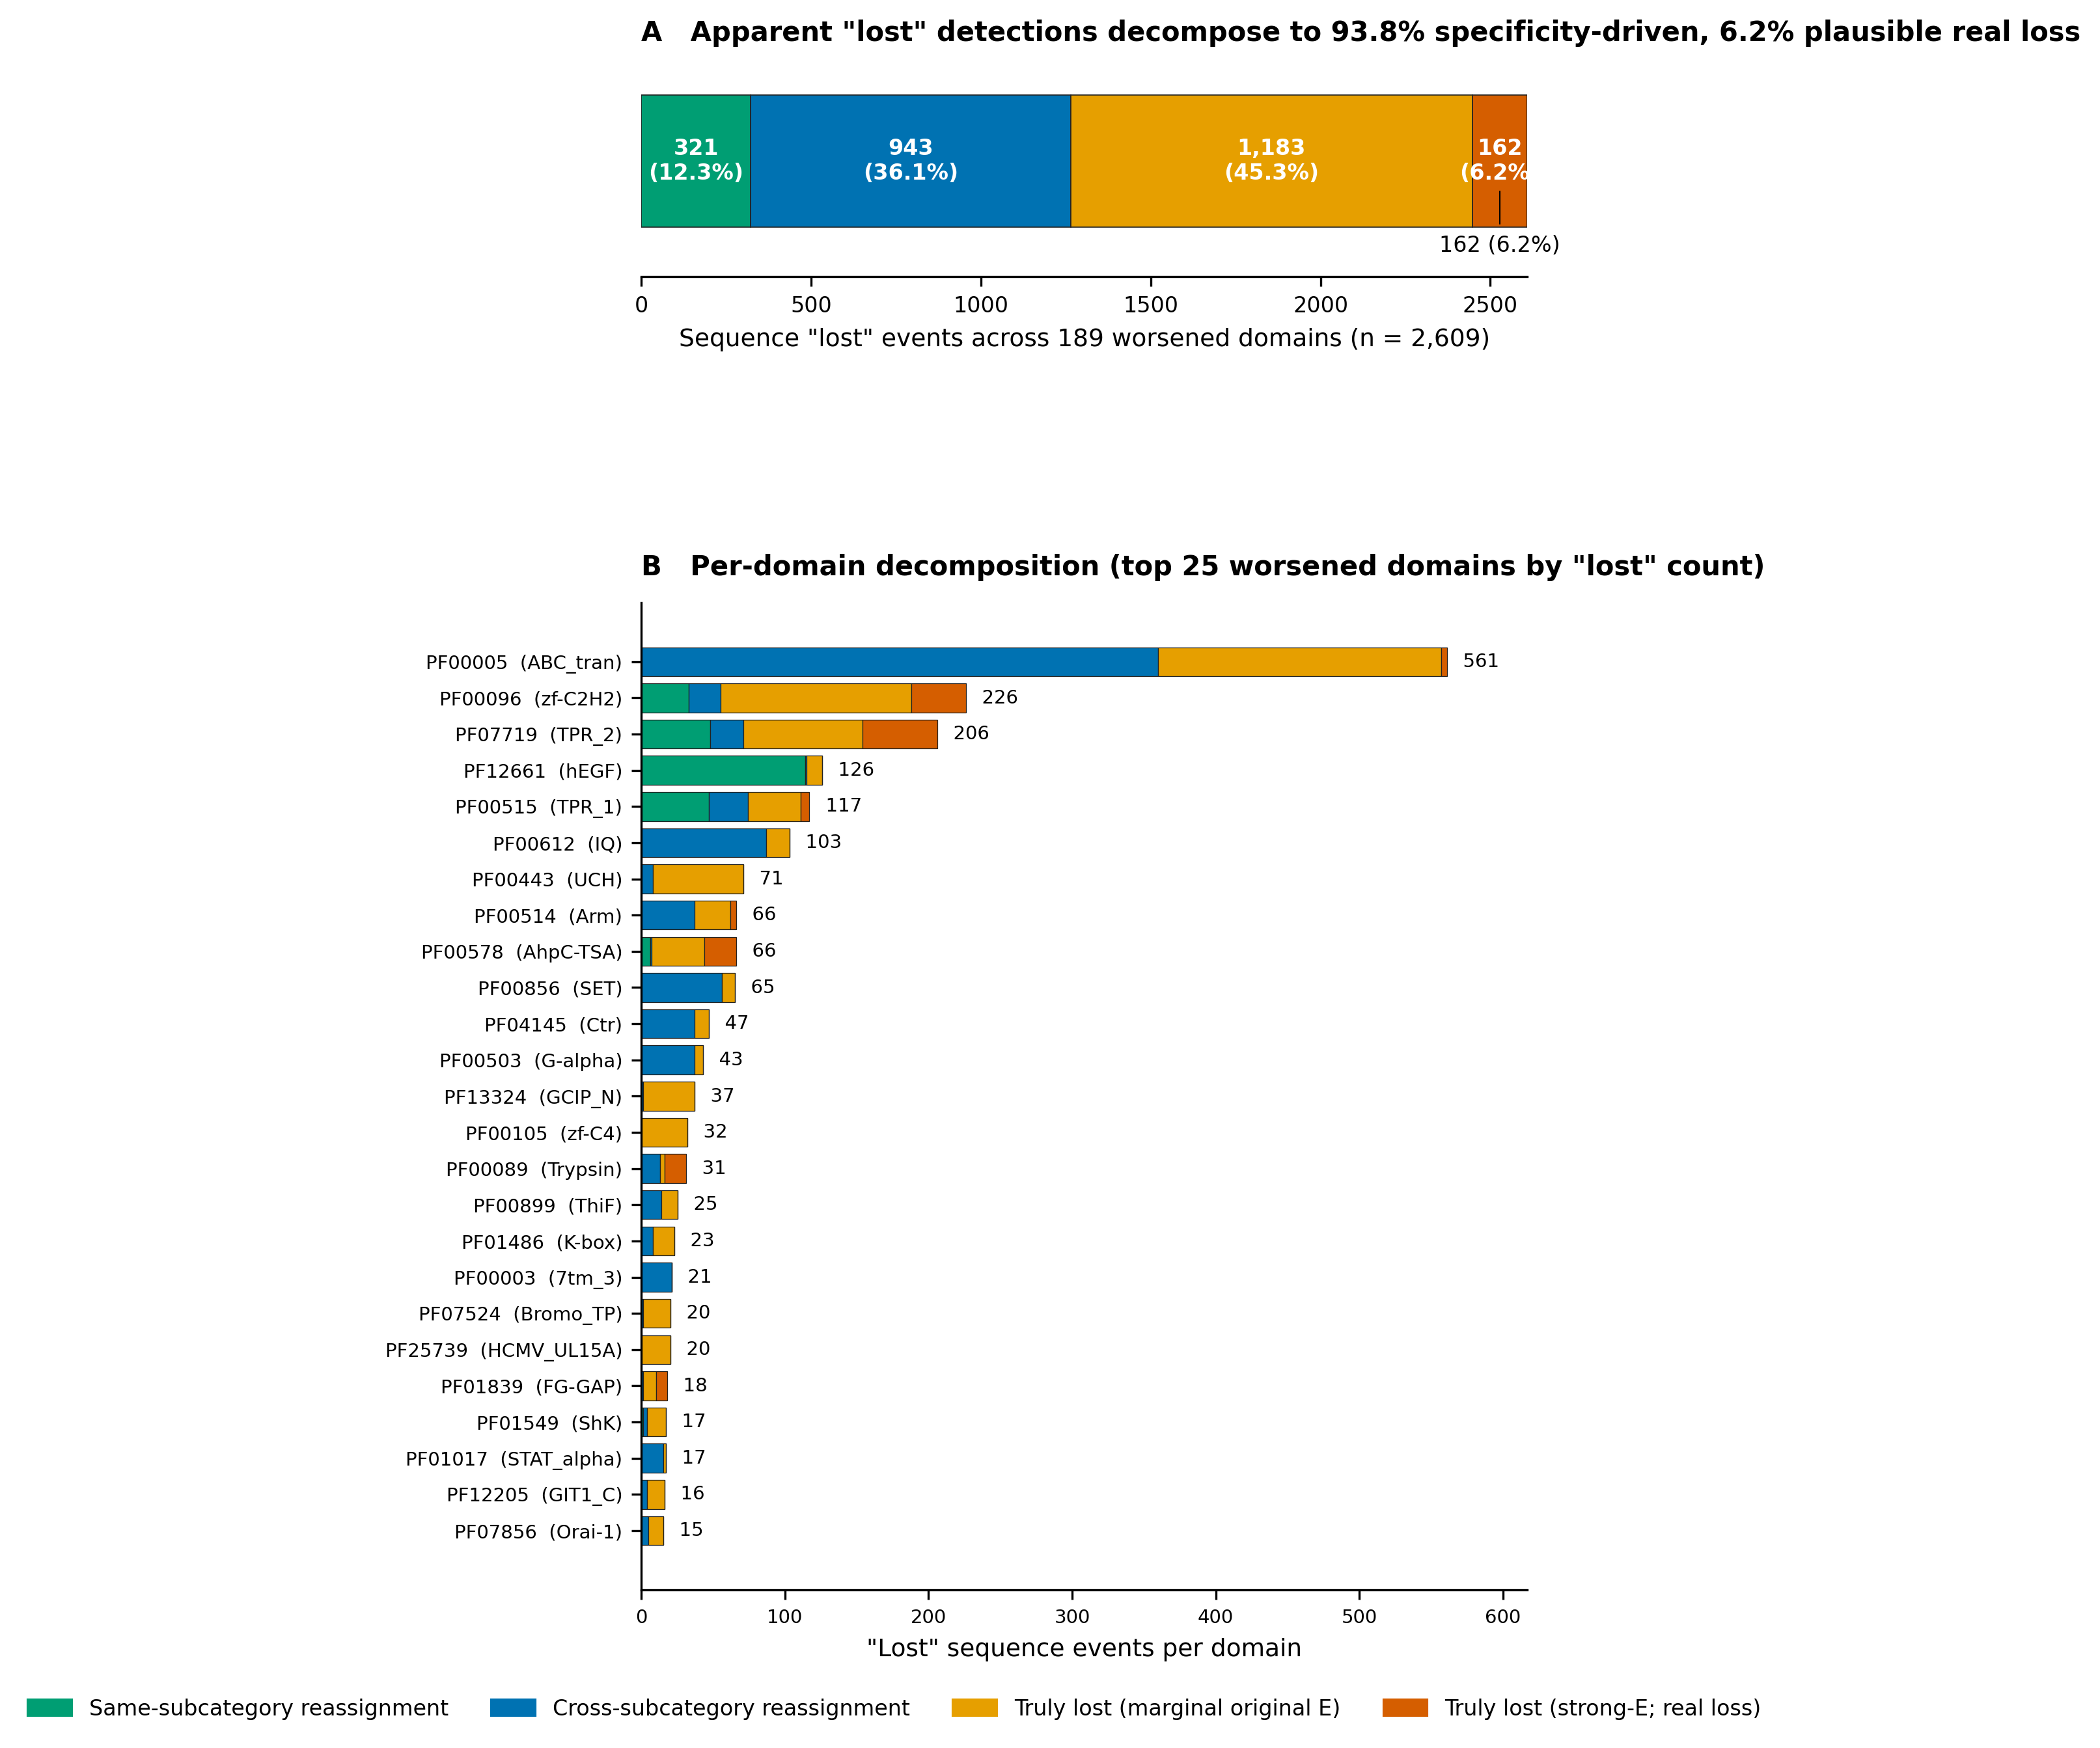
Specificity decomposition
A naive read of the comparison flags 189 domains as worsened (revised
< original on raw counts). To separate genuine sensitivity loss
from correct cross-reactivity refusal, we partition every
original-only sequence into one of four classes:
(1) same-subcategory reassignment — the sequence
still hits another revised domain in the same curation subcategory
(typical sister-family signal); (2) cross-subcategory
reassignment — the sequence hits a revised domain in a
different subcategory or theme (the revised HMM has refused a
promiscuous match); (3) marginal in original —
no revised hit, original full-E above 10−8 (weak
signal that the revised DB plausibly excludes); and (4) real
loss — no revised hit, original full-E at or below
10−8 (the only class that constitutes a defensible
sensitivity regression).